HVAD ER VO2Max?
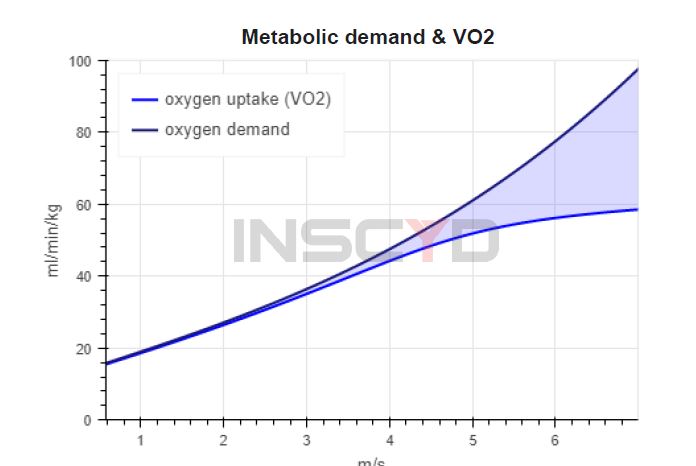
VO2Max nævnes ofte som en af de vigtigste målinger for udholdenhedssport og atletpræstation. VO2Max måler det maksimale volumen af ilt, en person kan udnytte under intensiv træning, og det måles i milliliter ilt (ml), som kroppen kan bruge pr. kilogram kropsvægt (kg) pr. minut (min).
Formlen for beregning af VO2Max er ml/kg/min, hvor V står for en fluxrate, O2 for ilt og max for “maksimum”.
FORDELENE VED EN HØJ VO2MAX
VO2Max beskrives ofte som “ilt motorens størrelse”, hvilket refererer til, hvor meget ilt din krop effektivt kan bruge til at producere energi under træning.
Men hvad er en god VO2Max, og hvordan påvirker det atletpræstation?