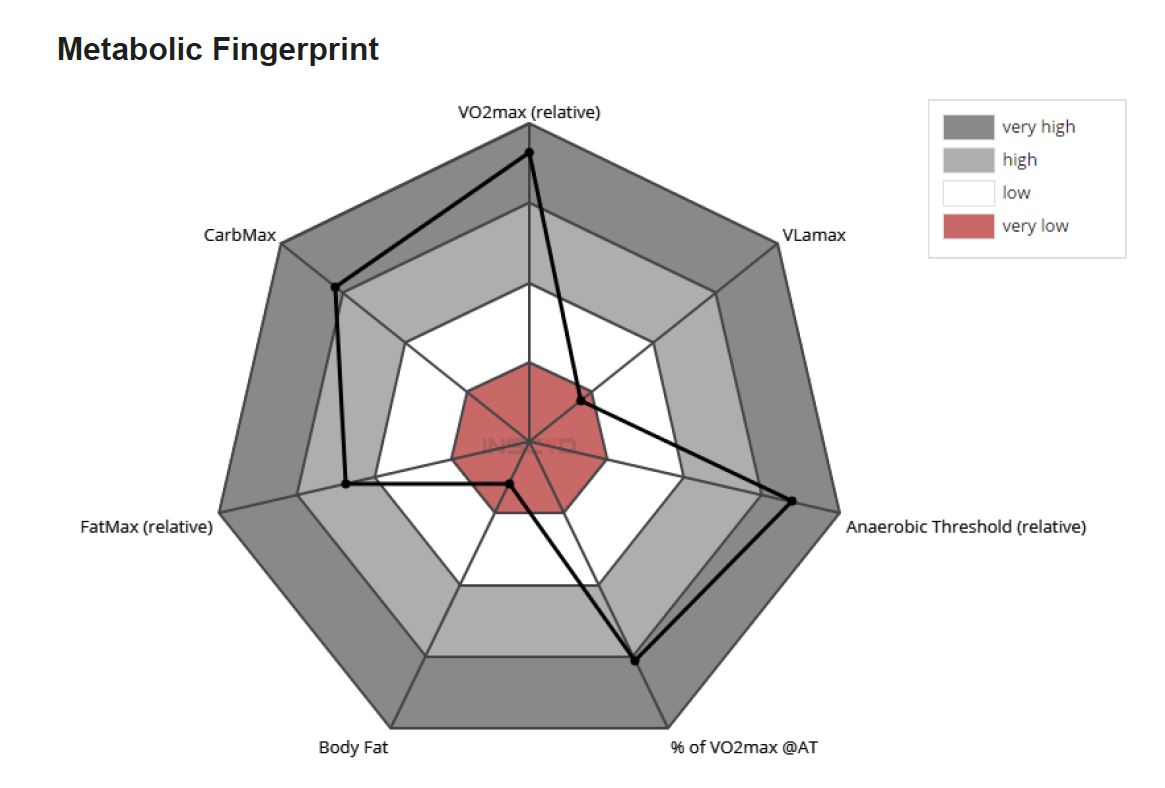
Styrker og svagheder: metabolisk overbliksbillede
Denne graf viser din styrke- og svaghedsprofil med et hurtigt blik.
De vigtigste præstationsmålinger vises og vurderes her. Vurderingen er baseret på dit køn, din sport og dit atletiske niveau (professionel, amatør, motionist).
Dine faktiske værdier bliver sammenlignet med en referencegruppe. Høje værdier er placeret på ydersiden af grafen. Lave værdier vises i midten (mod indersiden af grafen).
Hver atlet har sit eget individuelle præstationsfingeraftryk, med styrker og svagheder = områder, hvor han/hun er stærkere eller svagere. Sammenlign dette overblik med tidligere og fremtidige tests og se, hvordan du kan eller har reduceret dine svagheder og øget dine styrker.